|
UK grid frequency for the
past hour
NOTE: This chart currently
working in limited mode only. This is because our dynamic demand
prototype is currently being used for a laboratory test. Since February
2006, Intertek has been undertaking a test of dynamic demand fridges
on behalf of the Department for Environment, Food and Rural Affairs
as part of its Market Transformation Programme (MTP). Intertek are
using one of our prototype grid-monitoring devices to track grid
frequency and assess the effects of dynamic demand operation on
fridge performance. This web-meter is currently operating directly
from National Grid data. We will reinstall our own monitoring as
soon as possible.
Read a news story about the
MTP test here.

(Leave 5 seconds to load. Press
refresh to update)
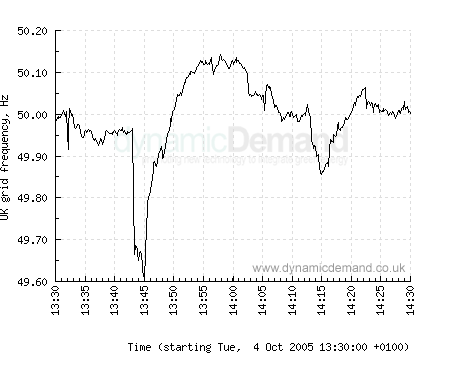
This chart shows the grid's "frequency",
which is related to the speed of rotation of generators
all over the country. When there is less power available, the whole
grid "slows down" (shown as dips on the chart).
Recent events that have affected
the grid
Sometimes events can happen that
cause the system frequency to move suddenly outside normal limits.
Below you can see the charts for various recent events, and an explanation
of what happened. Click the charts to zoom in.
| Sudden loss of generation, 4th October 2005 |
|
Just after 13:43, around 1000MW of generation (enough to
supply a million toasters) was lost in an instant due to a
fault. As a consequence, frequency plummeted.
The frequency-fall was halted by an automatic injection of
power mainly from partly-loaded back-up generators on the
system.
The National Grid operator is required to prevent frequency
falling below 49.5 Hz during these events.
Directly after events like this, National Grid will move
quicky to "resecure" the system, making it resilient
to a further loss of generation.
|

|
| Monarch of the Glen, 18th September 2005 |
|
As the hit BBC TV series Monarch of the Glen (BBC1) came
to an end, the "pick-up" in demand caused frequency
to fall below 49.8Hz.
Around three times as many people than predicted were watching
the programme.
National Grid prepares carefully for "TV pick-ups"
which are caused by many people suddenly undertaking activities
that they had been putting off during the show, such as putting
on kettles, turning on lights and even flushing toilets and
using taps (increased water demand entails more pumping which
uses more power).
|
|
| Two minute silence, 14th July 2005 |
|
During the two-minute silence for London bomb victims at
12 o'clock, many people stopped what they were doing to pay
their respects. This created a sudden suppression of demand
which the National Grid had to prepare for.
Events like this are difficult to predict as they do not
occur very often and it is hard to judge how many people will
be involved.
On its own, a suppression in demand will cause frequency
to rise as de-loaded generators begin to spin more quickly.
However, in this case it fell because National Grid had lined
up a large temporary reduction in generation to take place
at the same time.
The reduction in generation organised by National Grid was
in fact much larger than the demand-reduction caused by the
silence, which is why frequency fell in this case.
|
|
BACK to meter
|
|
|